Are you interested in understanding what R programming is and how to use it for analyzing data? Our team at takethiscourse.net has compiled a list of 15 Best R Programming Certification & Training Courses. With the help of the courses available in this list, you can find the right one for yourself and start learning today.
- Data Science: Foundations using R Specialization
- R Programming A-Z™: R For Data Science With Real Exercises!
- R Programming Fundamentals
- Data Science: R Basics
- Statistics with R Specialization
- Statistics and R
- Data Analytics and Visualization with Excel and R
- Data Analysis with R Programming
- Basics of Statistical Inference and Modelling Using R
- Data Visualization & Dashboarding with R Specialization
- Statistical Analysis with R for Public Health Specialization
- R Programming Basics for Data Science
- Analyzing Data with R
- Data Visualization with R
- R Programming: Advanced Analytics In R For Data Science
R Programming Certifications
Below are the names and details of the 15 Best R Programming Certifications.
Data Science: Foundations using R Specialization
-
-
- Johns Hopkins University via Coursera
- 5 months of effort required
- 79,651+ already enrolled!
- ★★★★★ (5,040 Ratings)
-
| Online Course Effectiveness Score | |||
| Content | Engagement | Practice | Career Benefit |
| Excellent ★★★★★ |
Excellent ★★★★★ |
Good ★★★★☆ |
Fair ★★★☆☆ |
In this course, you will be taught to use R for not only visualizing data but also cleaning and analyzing purpose. The instructor will explain in detail how you can ask the right questions and obtain data in the most effective possible manner. Then you will learn to perform reproducible research in detail. Similarly, the instructor will explain how to use GitHub for managing data science projects. After that, you will learn to set up R, R-studio, GitHub and other useful tools as well.
R Programming A-Z™: R For Data Science With Real Exercises!
-
-
- Kirill Eremenko via Udemy
- 23 hours of effort required
- 213,019+ already enrolled!
- ★★★★★ (41,921 Ratings)
-
| Online Course Effectiveness Score | |||
| Content | Engagement | Practice | Career Benefit |
| Excellent ★★★★★ |
Excellent ★★★★★ |
Fair ★★★☆☆ |
Fair ★★★☆☆ |
In this course you will learn all about programming in R and R studio. The instructor will talk about how to use R studio and understand all the core principles of programming in detail. Then you will learn to create vectors in R. Similarly, you will be taught to create variables in detail. After that, you will get a chance to learn about integers, double, logical, character, and other types in R. After that, you will learn to create a while loop and a for loop in R. Next, you will learn to build and use metrics in R and much more in detail. You can also checkout Data Science courses.
R Programming Fundamentals
-
-
- StanfordOnline via edX
- 6 weeks (2-3 hours weekly) of effort required
- Course type: Self Paced
- Course Level Introductory
-
In this course, the instructor aims to cover all the basics of R. You will understand all about the free programming language and the software environment used for statistical computing and graphics in detail. Then you will understand how R is widely used by data analyst and statisticians. Similarly, you will get a complete introduction to R including explanation of the entire installation process to understanding basic statistical functions. Then you will learn to work with variable and external data sets. After that, you will learn to write different codes in R language and much more.
Data Science: R Basics
-
-
- HarvardX via edX
- 8 weeks (1-2 hours weekly) of effort required
- Course type: Self Paced
- Course Level Introductory
-
In this course, you will first get an introduction to the basics of R programming. The instructor will explain in detail how you can retain R better by learning to solve a specific problem. Here you will use a real-world dataset about crime in the United States to make you understand everything in a clearer manner. Then the instructor will help you learn the R skills required to answer essential questions about differences in crime across the different states. After that, the instructor will cover the R’s functions and data types in detail. Next, you will learn to apply general programming features like “if-else” and “for loop” commands and more.
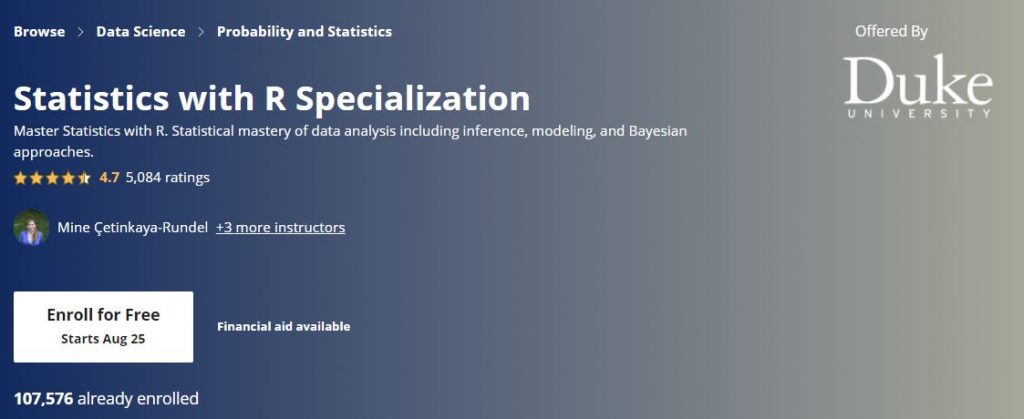
Statistics with R Specialization
-
-
- Duke University via Coursera
- 7 months of effort required
- 107,074+ already enrolled!
- ★★★★★ (243 Ratings)
-
| Online Course Effectiveness Score | |||
| Content | Engagement | Practice | Career Benefit |
| Excellent ★★★★★ |
Excellent ★★★★★ |
Good ★★★★☆ |
Good ★★★★☆ |
In this specialization, you will get to learn to analyze and visualize data in R. The instructor will explain in detail how you can create reproducible data analysis reports. Then the instructor will demonstrate a conceptual understanding of the unified nature of statistical inference. Similarly, you will be taught how to perform frequent it and Bayesian statistical inference and modeling. Then you will understand the natural phenomena for making data-based decisions. Going further, you will learn to communicate statistical results correctly. Thus this and much more will be learned from this specialization. You might also be interested in UC learn free online courses.
Statistics and R
-
-
- HarvardX via edX
- 4 weeks (2-4 hours weekly) of effort required
- Course type: Self Paced
- Course Level: Intermediate
-
This is a type of course that aims to teach the R programming language in the context of statistical data and statistical analysis in the life sciences. The course starts with the introduction to the basics of statistical inference. This will help you understand and computer p-values and confidence intervals. Then you will understand the robust statistical techniques in detail. After that, you will learn the basics of conducting reproducible research by using R scripts for analyzing data and much more in detail. You might also be interested in Online Python Specialization Courses.
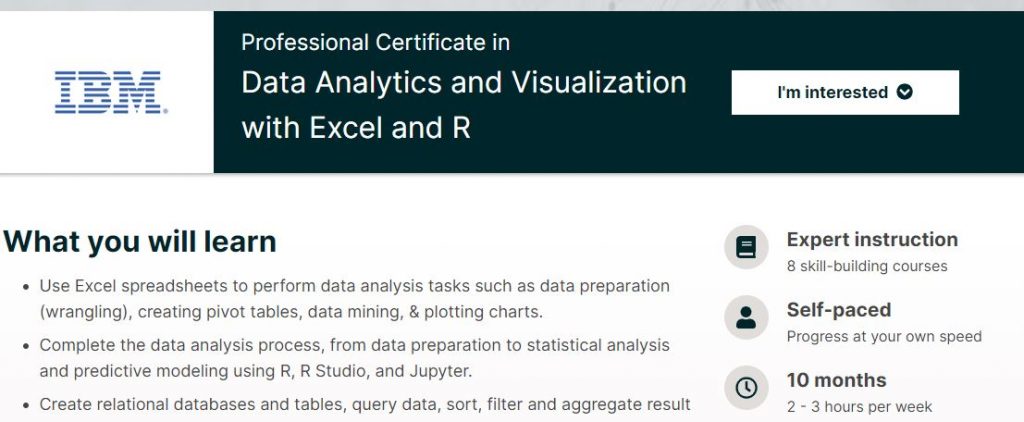
Data Analytics and Visualization with Excel and R
-
-
- IBM via edX
- 10 months (2-3 hours weekly) of effort required
- Course type: Self Paced
-
In this course, you will be taught how to use Excel spreadsheets for performing data analysis tasks. This includes data preparation, creating pivot tables, data mining, and plotting charts. You can find out the comparison between R vs Python. The instructor will explain the data analysis process in detail. From data preparation to statistical analysis and predictive modeling using R, you will learn everything in detail.
Data Analysis with R Programming
-
-
- Google via Coursera
- 23 hours of effort required
- 38,029+ already enrolled!
- ★★★★★ (795 Ratings)
-
| Online Course Effectiveness Score | |||
| Content | Engagement | Practice | Career Benefit |
| Excellent ★★★★★ |
Excellent ★★★★★ |
Good ★★★★☆ |
Good ★★★★☆ |
In this course, the instructor will explain the R programming language and its programming environment in detail. You will understand the fundamental concepts associated with this programming including functions, variables, data types, pipes, and vectors, and more. Then the instructor will describe the options for generating visualizations in R and much more in detail. You can also find out different types of Data Analysis.
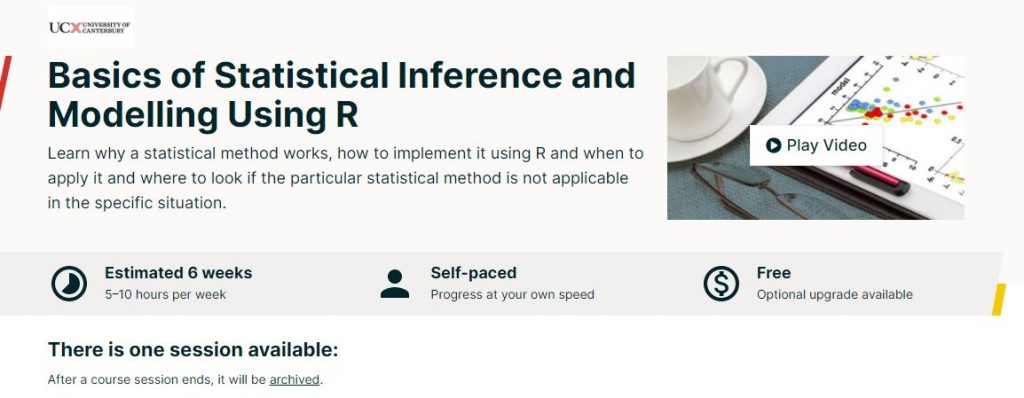
Basics of Statistical Inference and Modelling Using R
-
-
- University of Canterbury via edX
- 6 weeks (5-10 hours weekly) of effort required
- Course type: Self Paced
- Course Level: Intermediate
-
Do you want to learn how a statistical method works and how you can implement it using R? In this course you will learn to do that at your ease and pace. The instructor of this course aims to give students the understanding of why this methods works and how to implement it using R programming. Check out the best + free coding classes with certificates.
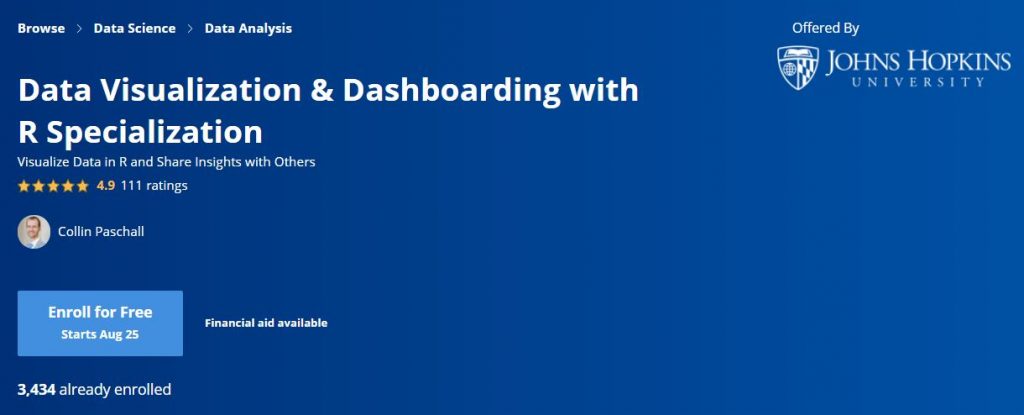
Data Visualization & Dashboarding with R Specialization
-
-
- Johns Hopkins University via Coursera
- 4 months of effort required
- 3,319+ already enrolled!
- ★★★★★ (119 Ratings)
-
| Online Course Effectiveness Score | |||
| Content | Engagement | Practice | Career Benefit |
| Excellent ★★★★★ |
Excellent ★★★★★ |
Good ★★★★☆ |
Good ★★★★☆ |
This specialization has been designed for all the learners who aim to develop the ability to visualize data using R. The specialization has five courses in it and with each course, you will get to learn something new. You will learn to use R to create static and interactive data visualizations. Then you will learn to publish them on the web. After that, you will generate many different types of visualizations. This will help you explore data from simple figures like bar plots and scatter plots to interactive dashboards. After that, you will integrate all these figures into reproducible research products and then share them online. You can also find out Data Visualization Techniques.
Statistical Analysis with R for Public Health Specialization
-
-
- Imperial College London via Coursera
- 4 months of effort required
- 17,543+ already enrolled!
- ★★★★★ (1,160 Ratings)
-
| Online Course Effectiveness Score | |||
| Content | Engagement | Practice | Career Benefit |
| Excellent ★★★★★ |
Excellent ★★★★★ |
Good ★★★★☆ |
Good ★★★★☆ |
Through this specialization, you will get the opportunity to master statistics for public health from the comfort of your home. With that, you will get to learn R and develop your statistical thinking skills in a step by step guide. After that, you will get a chance to interpret the output for your analysis and appraise the role of chance and much more in detail.
R Programming Basics for Data Science
-
-
- IBM via edX
- 5 weeks (1-2 hours weekly) of effort required
- Course type: Self Paced
- Course Level: Introductory
-
As we all know that the R programming language plays a vital role in data analysis. It is a common programming language used when working in the field of data science and analytics. In this course, you will get a detailed introduction to R language fundamentals. The instructor will explain all about the data types and the techniques used for manipulation. You will learn to implement fundamental programming tasks in detail. After that, you will understand the common data structures and programming fundamentals and much more.
Analyzing Data with R
-
-
- IBM via edX
- 6 weeks (2-3 hours weekly) of effort required
- Course type: Self Paced
- Course Level: Intermediate
-
This is a very engaging course that starts with a question and then walks you through the process of answering it through data. Here you will first understand and learn the important techniques for preparing or wrangling your data for analysis. Then you will learn to gain a better understanding of your data through exploratory data analysis. Thus this is how you will learn to analyze data with R. You can also find out more best free online Courses with certificates at takethiscourse.net Platform click here.
Data Visualization with R
-
-
- IBM via edX
- 4 weeks (1-2 hours weekly) of effort required
- Course type: Self Paced
- Course Level: Intermediate
-
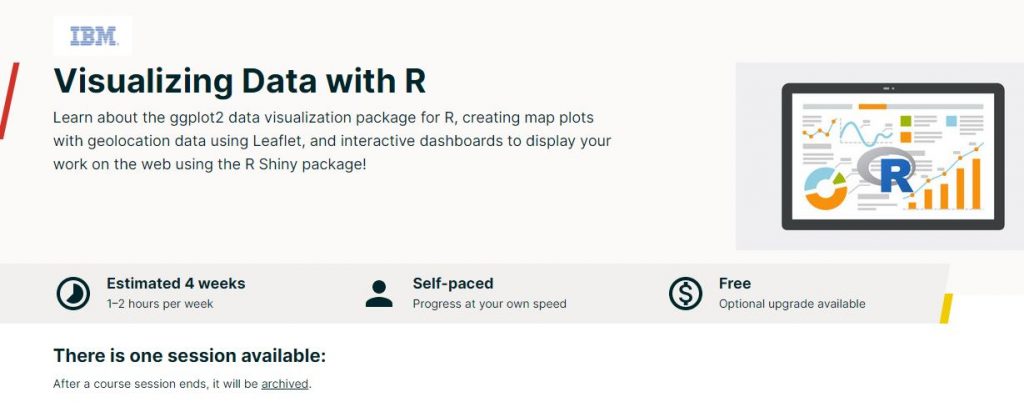
This is a type of course in which you will learn about the Grammar of Graphics in the most effective possible manner. The instructor will explain in detail about this system that is used for describing and building graphs. You will understand how the ggplot2 data visualization package for R applied this concept to basic bar charts and histograms and pie charts. Then you will know all about scatter plots, line plots, and box plots in R as well.
R Programming: Advanced Analytics In R For Data Science
-
-
- Kirill Eremenko via Udemy
- Course type: Self Paced
- 51,537+ already enrolled!
- ★★★★★ (7,235 Ratings)
-
| Online Course Effectiveness Score | |||
| Content | Engagement | Practice | Career Benefit |
| Excellent ★★★★★ |
Excellent ★★★★★ |
Fair ★★★☆☆ |
Fair ★★★☆☆ |
Do you want to take you R & R studio skills to the next level? In this course, you will learn all about data analytics, data science, and statistical analysis in business in detail. The instructor will explain in detail how to perform data preparation in R. Then you will learn to identify missing records in dataframes. After that, you will learn to locate kissing data in your dataframes in detail. Next, you will learn to apply the median imputation method for replacing missing records. After that, you will learn to apply factual analysis method for replacing missing records and much more in detail.
Programming Courses
100+ Courses
★★★★★
Cybersecurity courses
30+ Courses
★★★★★
Business Courses
70+ Courses
★★★★☆
Blockchain Courses
20+ Courses
★★★★★
Data Science Courses
150+ Courses
★★★★★
Mobile App Development Courses
50+ Courses
★★★★★
Final Thoughts
If you want to learn R programming from the comfort of your home then this list of 15 Best R Programming Certification & Training Courses is what you need. So take a look at what this list has to offer and choose the one that is most suitable for you and never stop learning. If you’re interested in Best FRM Courses then click here.
